shaderware recommend this title as an accompaniment to virtual radiographyTM

shaderware recommend this title as an accompaniment to virtual radiographyTM
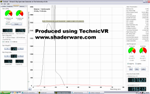
 | On opening the program, TechnicVR looks like this. |
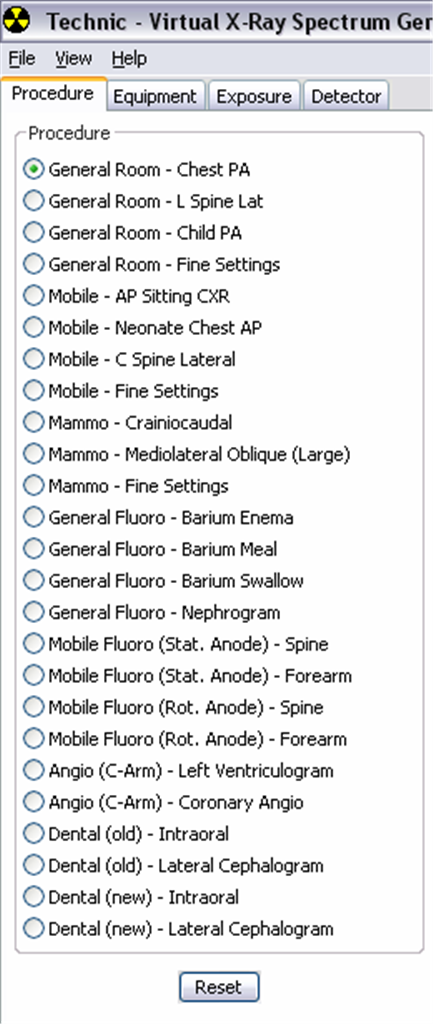 | On the left, 4 tabs are visible (Procedure, Equipment, Exposure and Detector); this is the procedure tab which allows fast setup of various procedures. |
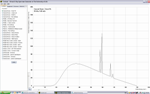
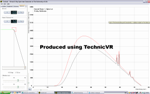
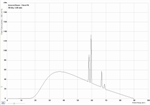 | The other part of the window is reserved for the graph of the x-ray spectrum. The axes can be altered by using the sliders; the graph is automatically resized to fit the current spectum by using the AS button. |
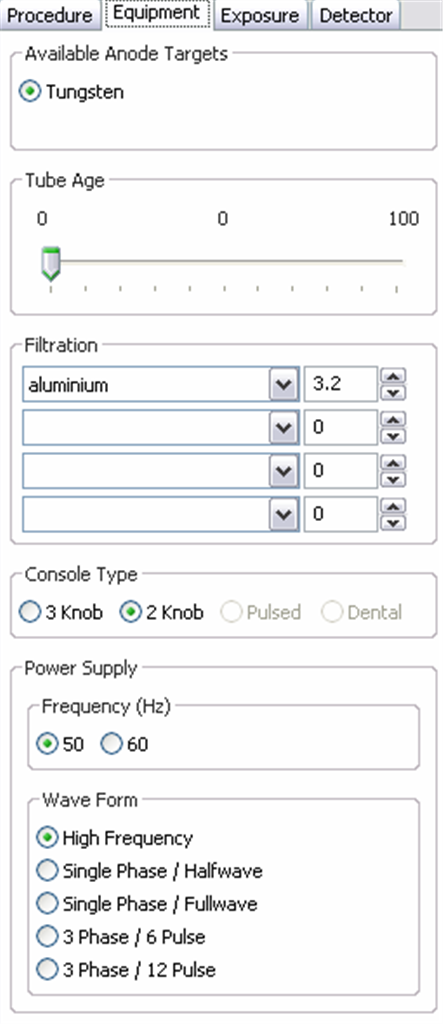 | The equipment tab. This is populated by the procedure selection, but can be fine tuned by the user. There are over 40 different selectable filter materials. The tube can be 'aged' and here the type of generator can be chosen. The choice of mAs or mA and S settings on the Exposure tab is made here. |
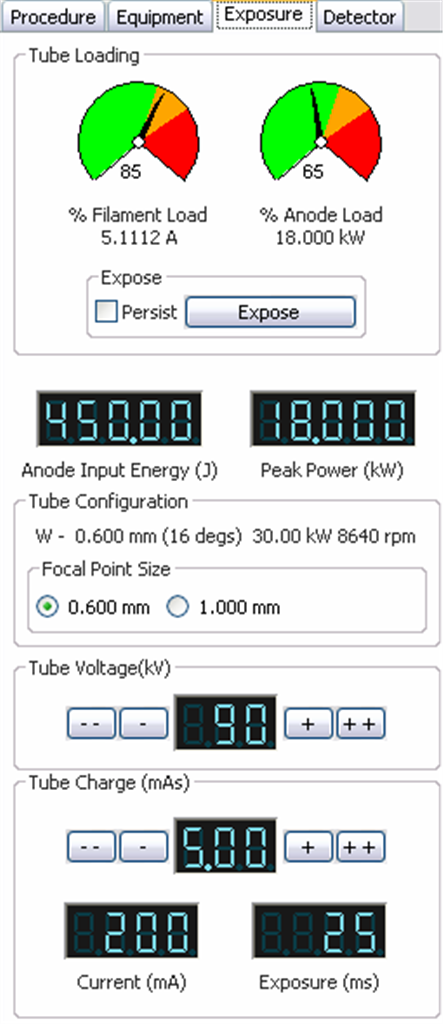 | The familiar exposure factors can be set here, mAs and kVp. The tube ratings charts are used to show filament and anode loadings. The Exposure button has a 'persist' option to allow more than one spectrum to be displayed on the graph for comparisons. |
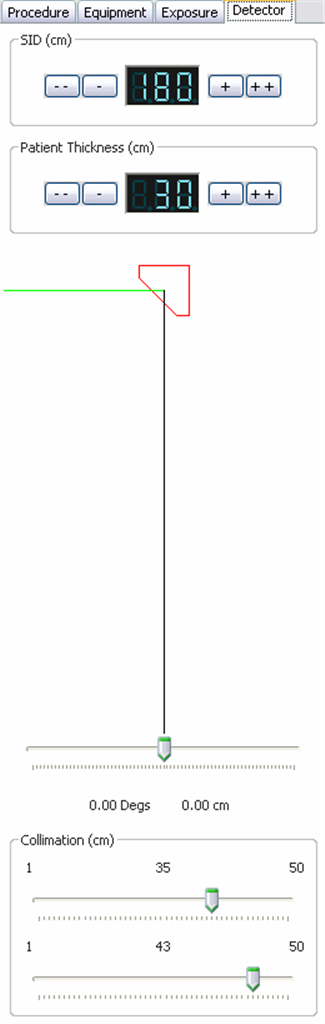 | The data for the spectrum graph and the beam characteristics all come from a virtual detector placed somewhere in the beam. The detector tab allows the user to position this detector, and alter the colimation. |
 | A dynamic demonstration of the anode heel effect can be achieved by draging the detector toward the anode. The spectrum will change in real time accordingly. Changing the SID and the tube type will also make a difference. |
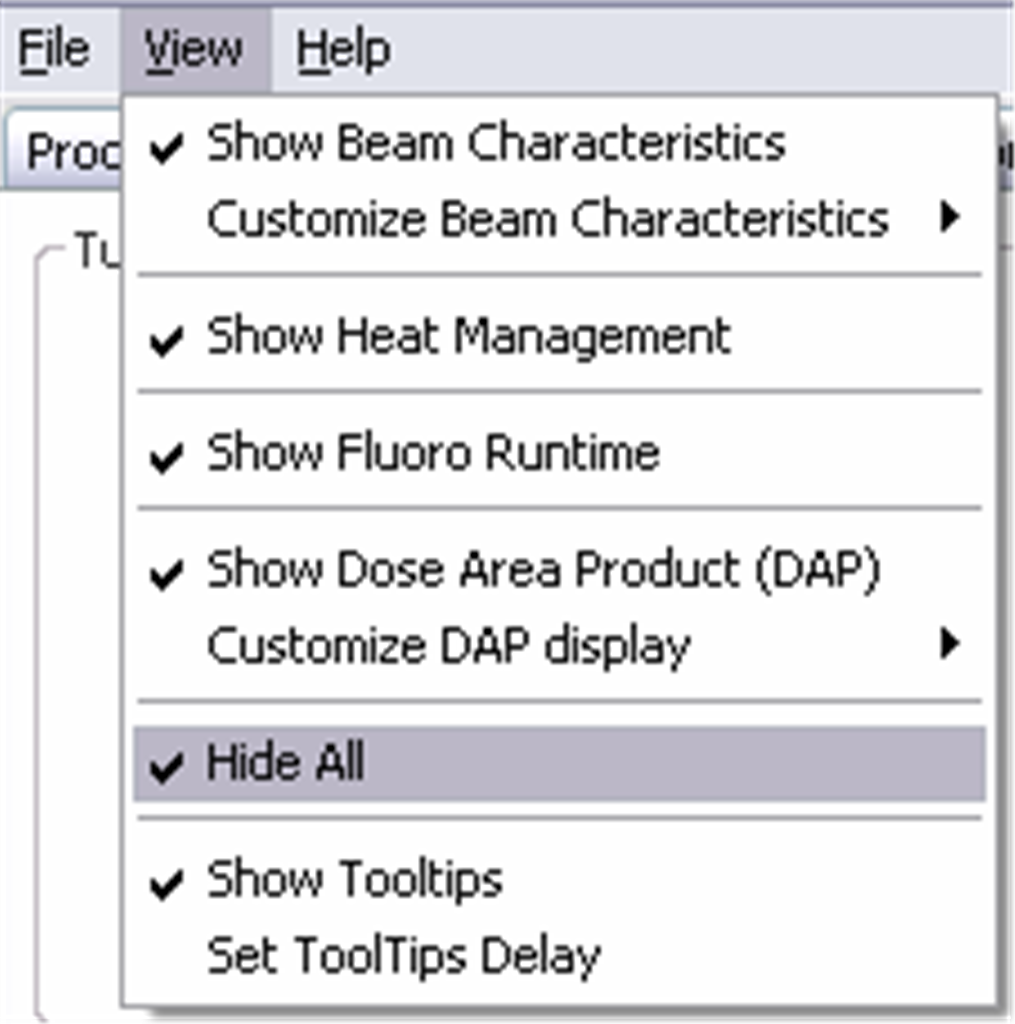 | On startup the screen is kept simple and clear. The right hand panel is hidden. This can be revealed by deselecting the 'hide all' oprion in the view menu. |
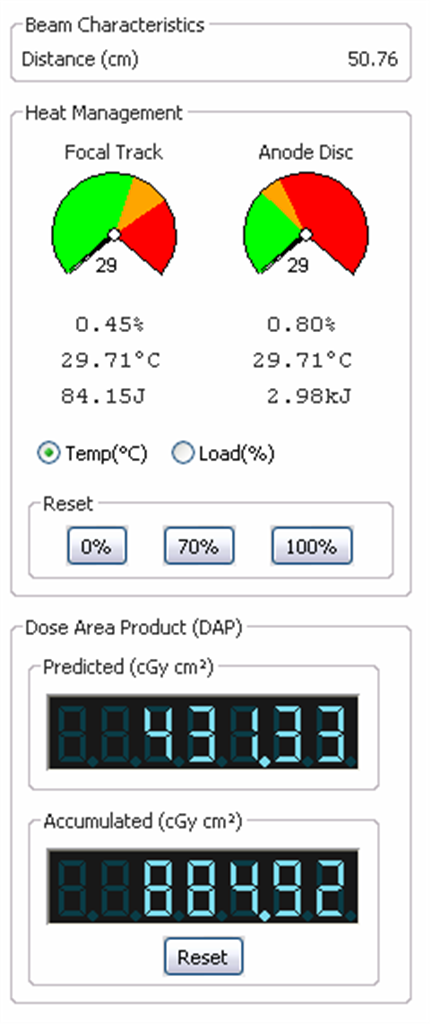 | The right hand panel shows the 'Beam characteristics' (initially only the distance from the source to the detector), the heat in the tube, and the dose area product. |
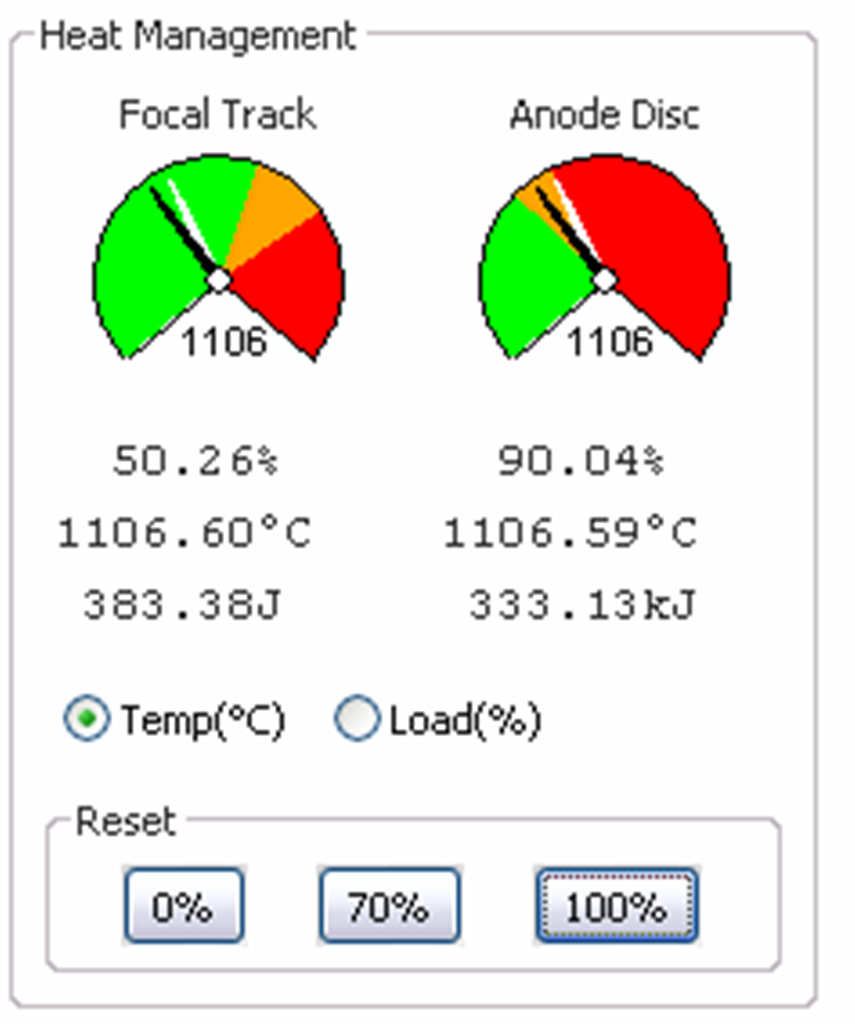 | The peak temperature (or loading) is shown by a white needle on the dials, the current temperature (or loading) is the black needle. The tube cools in real time - but can be reset to 0%, 70% or 100% using the buttons. |
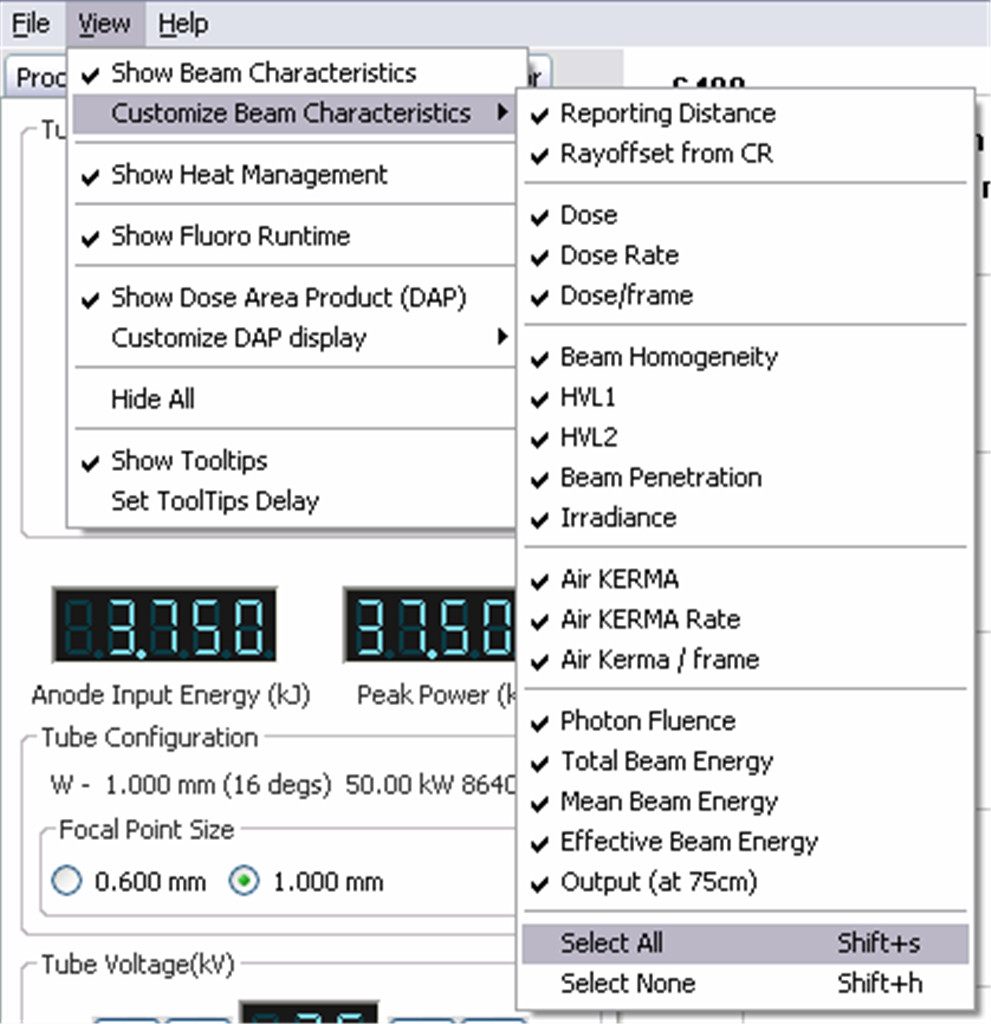 | There are 17 different 'readings' from the 'detector' that can be displayed. It is unlikely the user would want all displayed at the same time, so they can be selected in the view menu. |
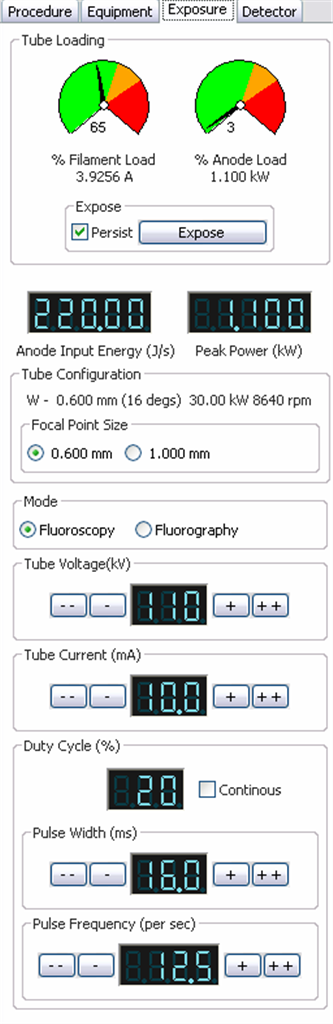 | Special procedure machines have a more complicated control panel. The exposure can be set to be either 'fluoroscopy' (which is usually low mA and high pulse rate) or fluorography (which is high mA and lower pulse rates, except for cardiac angiography). The number of pulses per second can be set; the exposure time can't be set, but the 'width' of each pulse can. |
 | TechnicVR allows direct comparison visually of the x-ray beams incident on the patient for different examinations and settings; here are dental and mammography beams compared. |